Node.js logging solutions
2020-01-29
Do you feel lost when something happens and your logs don’t show any useful information?
Ok, me too. So I decided to do something about it. I started as everyone, using Morgan as an easy way to log requests and responses. Morgan is a middleware that listens to each request made to the server, the request continues down the pipeline and finally logs request and response information in one line. It saves a lot of time because you don’t have to manually create those logs.
But I need more. As I said, it shows request and response information in one line. What if you want to log something after the request was logged and before the response line in the log? E.g.

This can’t be done with Morgan. I need something more flexible, something that lets me log whatever I want, whenever I want… without losing the automation gained with Morgan. To achieve this I went over the most popular module for logging, which is Winston.
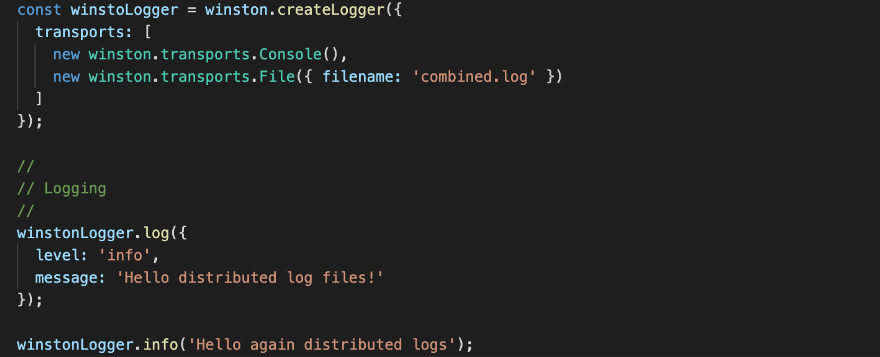
Winston lets you log whatever you want. You just need to create it and call it.

Winston decouples parts of logging and makes it extensible and flexible. It can be configured to multiple levels of logging and has a large and robust feature set. So for us, it was natural to mix both solutions.

With this code, I use Morgan to automate the request-response log, but I use Winston as a renderer to keep a consistent format between automatic and manual logging.
So, with a couple more configurations (mostly in Winston formatter) I end with a logger like this:

There I see two request-response cycles, both done from a web browser that returned 304 as status code. Requests are represented with -> while responses are <-. Messages sent between request and response are marked as --.
Has it happened to you that a user reports some issues and you don’t have a way to follow its trail in the logs?
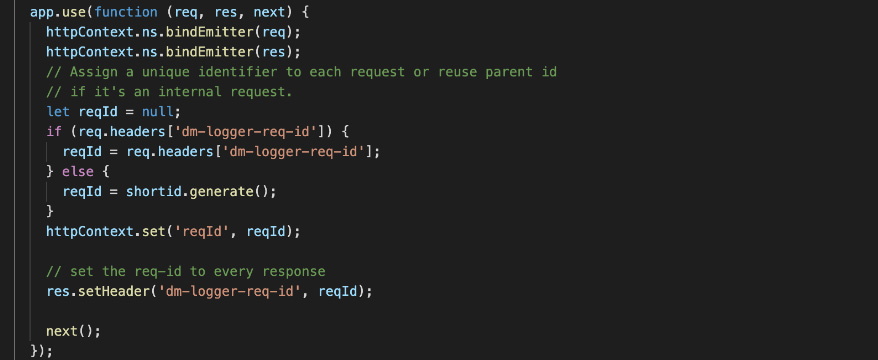
If this hasn’t happened to you, you are a lucky guy. I need a way to trace down some user from its first request to the last response. Also, I need to trace the internal calls (e.g. calls to microservices or endpoints). Remember that in production, with say 50 requests/sec, your logs sorted by time would be mixed between several requests from different users. How can I achieve this? I implement a middleware that adds an ID to the first request, or if the request came with an ID as header variable, use it instead.

Using express-http-context I make the ID available to be used anywhere. Also, because I add it to the response header, you can follow the trace even to the client-side for further use (e.g. if you experiment issues in the client-side, you can take note of that ID and later search for it in the logs server-side). The ID is the one between square brackets in the previous output sample.
Have you ever wanted to change the verbosity of your logs in realtime, without restarting your server, just to catch a slippery bug?
Finally, I need to change the verbosity level of the log in realtime, without restarting the server. The reason behind this is that e.g. when I’m debugging, I want to see the queries executed against the database. Sometimes I want to log a complete JSON object, or just generate more information on some level, other than debugging, to be consumed in special opportunities. For these reasons, we choose to log using syslog severity levels.

In this example, the logger is my solution to logging and I am calling it in the catch, twice… but with different severity levels. Functions called emerg, alert, crit, error, warning, notice, info and debug are available from Winston. As the doc says “Logging levels in Winston conform to the severity ordering specified by RFC5424: severity of all levels is assumed to be numerically ascending from most important to least important.” So you can define a level to initiate which specifies the maximum level of messages that it should log and then change it.
To change it, I added an endpoint (fully configurable via options) that lets you make requests to it setting the desired level. As soon as the endpoint receives this parameter, it will change the logging level until you send another request asking to change it again.
e.g. curl localhost:5000/?set_log_level=debug will set the default log level to debug, so basically it will log everything!
Conclusion
With all these ideas, and to have all the same logging solutions, with the same format, on every project, we built a module and made it publicly available in GitHub, so you can use it too.
Acknowledgments
This post was written for Vairix Software Development, so I want say thanks to them for let me share this with you in my homepage.
Significant Revisions
Dec 27, 2019: Original publication on vairix.com
Jan 29, 2020: Original publication on dariomac.com
