PwC - Supervisor - Senior Developer - IT Consultant
Nov 2004 – Mar 2014 (9 years 5 months)
Software Engineer in .NET technologies for many years, acquiring experience in software development in Microsoft® environment. For ~10 years, I used my skills with .NET MVC, C#, SQL Server and TFS, my keen eye for detail & quality, and my knowledge to work through the entire software lifecycle. Finally, in the last four years at PwC, I helped with project management and cost estimation tasks.
I worked as a Software Engineer in .NET technologies for many years, gaining experience in software development using Microsoft® environments. During those 10 years, I used my skills with .NET MVC, C#, SQL Server and TFS, my sharp eye for detail & quality and my knowledge to work through the entire software lifecycle. Finally, in the last four years at PwC, I helped in project management and cost estimation tasks.
Web development & support for PwC US online marketing team, PwC Global and PwC UK
Development of web projects that includes intensive Javascript usage, JQuery, SVG interaction and animations. Some of these projects are benchmark tools and small surveys with animated charts (almost always Highcharts charts). Other projects have complex interfaces with SVG maps with different layers of information over it. Those complex solutions usually interact with other page elements, so most of the time they are a mix of SVG , JQuery , Raphaël all together glued by Javascript. As these kinds of projects are client-side and usually involve some kind of external data, they are based on JSON data files. These data files may be rendered as a chart or in some cases, bound to HTML elements through KnockoutJS.
Marketing Calendar
Application to show marketing activities filtered by event type, month, line of service and economic sector. It also lets the user sort the activities by title and date. Led to high-profile users inside the firm. ( jQuery, UnderscoreJs, FilterJs)
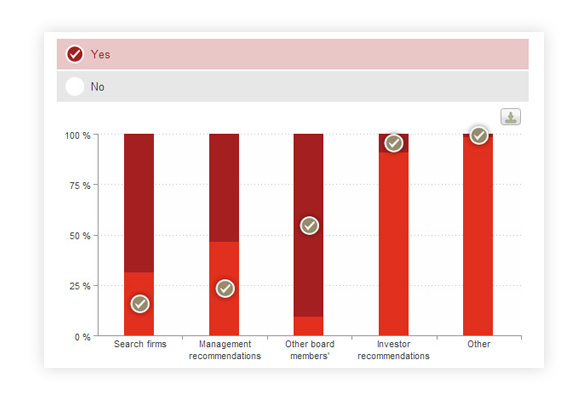
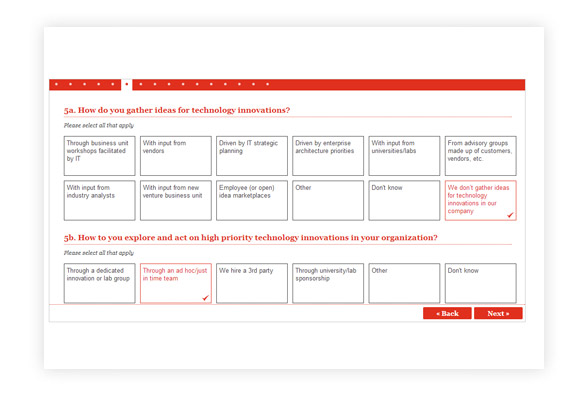
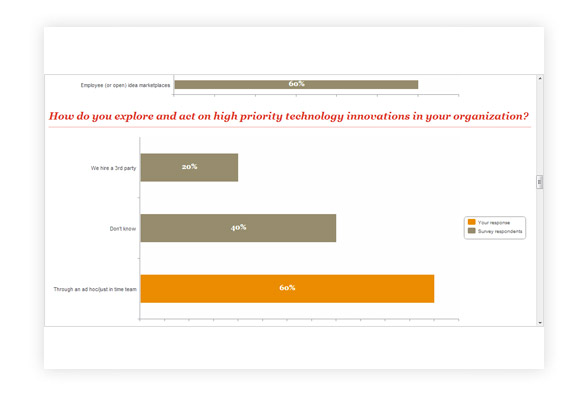
US CBG Corporate Director Survey (Benchmarking tool)
Collaboration in the development of this tool that allows users to compare themselves with the results of the PwC's 2012 Annual Corporate Directors Survey. Users select the desired theme/subject and their company size, and then can compare their answers to some of the questions to the corresponding results. (jQuery, HighchartsJs)

Benchmarking Tool
Requirement elicitation, design and implementation of a data-driven benchmarking tool which was developed for the Digital IQ publication. This application allows the creation of complex online benchmarks based on standard templates. ( KnockoutJs, jQuery, ASP.NET MVC, eXpress Persistent Objects, DevExpress Snap Report)

PwC Gage
Collaboration in the development of a tool that helps with the creation of gauge charts inside the PwC CMS. It was designed as a wrapper plugin for justgage to create gauges following PwC branding guidelines that display correctly on a wide variety of browsers and devices. The editor was intended to provide basic configuration options for the gauge, although further customization can be done by editing the generated code. (jQuery, JustGageJs)
TIMM Scenario Wheel
Requirement elicitation, design and implementation of a "Polar chart" animation that shows twenty impact values of one of two available options. This interactive scenario model shows the PwC TIMM Framework in action. Under the hood it's a SVG animation with a set of values (positive or negative) with smooth animated transitions between the two options. The animation was built with a SVG/HTML animation engine also developed by me. (jQuery, RaphaëlJs, SVG)
Paying Taxes homepage animation - 2013
Requirement elicitation, design and implementation of the Paying Taxes homepage animation which shows one indicator at a time using local determination to define the values for each indicator per location. Depending on local determination, some paying taxes indicators are loaded and then displayed to the user. It's an SVG animation in the background (calculator, clock, money) with a layer of HTML animated through a jQuery plugin. The animation was built with our own SVG/HTML animation engine. (jQuery, HighchartsJs, RaphaëlJs, SVG)

Aviation Paper Data Modeler
Collaboration in the development of a tool to show the commercial aircraft manufacturing attractiveness ranking indices for US states using weighted averages of different variables. The states of the map are shaded according to their overall manufacturing attractiveness ranking composed of the three variables described above. The toolbar on the right allows exploring the US aviation manufacturing attractiveness index by selecting US states to find rankings in each of the three variables, plus an overall composite ranking. ( jQuery, jQueryUI, TimJs, RaphaëlJs, SVG)
Tweetable content
Requirement elicitation, design and implementation of a reusable module that enables site users to share via Twitter paragraphs/phrases previously tagged as tweetable by site developers. This module transforms paragraphs or phrases tagged into tweetable chunks of text. There are two styles, one inline, suitable for short phrases, and another for paragraphs with a quote style. ( jQuery)
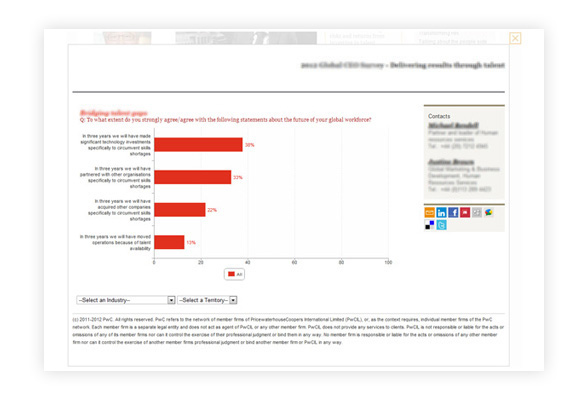
Cities of Opportunity 2012: 'Where the jobs are…'
Requirement elicitation, design and implementation of an interactive map, which allows users to navigate the data results from a survey. This tool integrates both SVG mapping capabilities with the PwC Charting tool. Users can select up to three cities from a world map, then they can select the indicators they want to compare, and finally they can access an animated chart with the results. ( KnockoutJs, JQuery, HighchartsJs, RaphaëlJs, SVG)
Paying Taxes: Comparative modeller 2012-2013
Requirement elicitation, design and implementation of a tool to make PwC's latest comparative global tax study available for the user. It lets users explore nearly a decade of data through a powerful and interactive modeller, analysing and comparing the different business tax systems, across numerous geographies, themes and trends of 189 global economies. The user can choose between economies or regions and compare them on total tax rate, the time to comply and number and types of payments. ( KnockoutJs, jQuery, HighchartsJs, RaphaëlJs, SVG)
US Careers Maps
Requirement elicitation, design and implementation of interactive maps for the US careers site. Simple SVG map interaction, allowing the users to expand information from different states. ( jQuery, RaphaëlJs, SVG)

Health insurance rate map
Coaching and collaboration in the development of a US map that shows the health insurance cost. The interactive US map lets the user change between two options in order to see different datasets using a suitable color codification. ( jQuery, RaphaëlJs, TimJs, SVG)
eSirem - Salary survey
Requirement elicitation, architecture, design and implementation of a Salary Survey system that provides comprehensive measures of occupational wages; employment cost trends, benefit incidence and detailed plan provisions. It also details the occupational earnings that are available for metropolitan and non-metropolitan areas, broad geographic regions, and on a national basis. Salaries are provided only as means of reference taking into consideration a wide range of factors that affect the salary that a professional is entitled to, including prior experience and education, industry, and specific skills and attributes. The system lets the users perform comparisons between their companies and the rest of its market sector. Now it's used by several South American countries because it has the flexibility to adapt to the standards and pay rules for every country being very highly configurable due to its versatile architecture. (ASP.NET, Oracle 10).
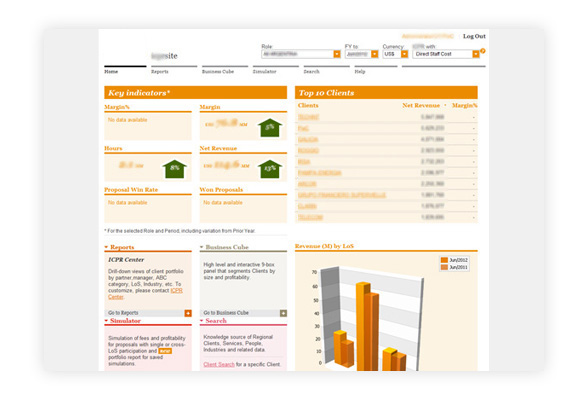
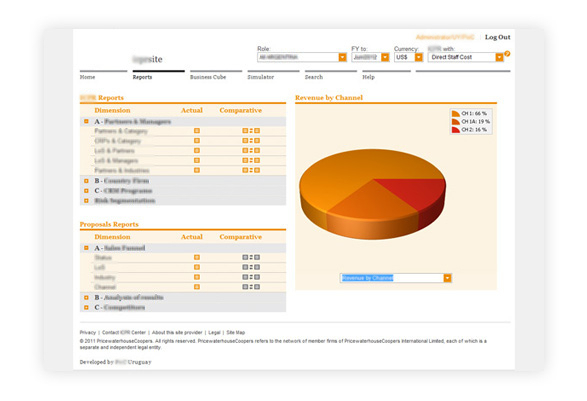
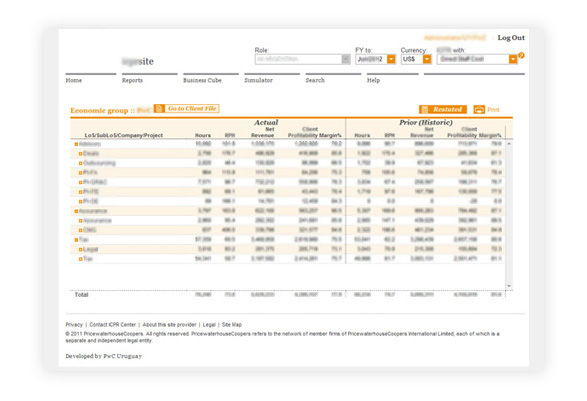
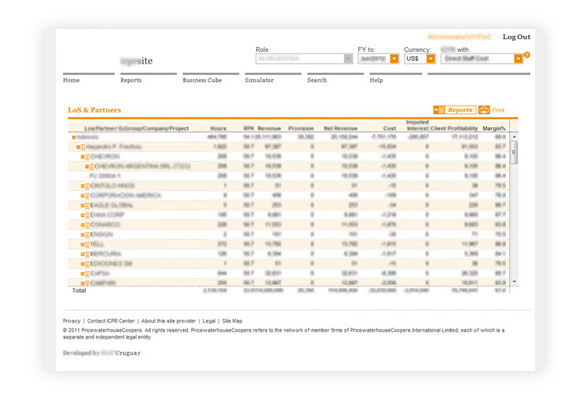
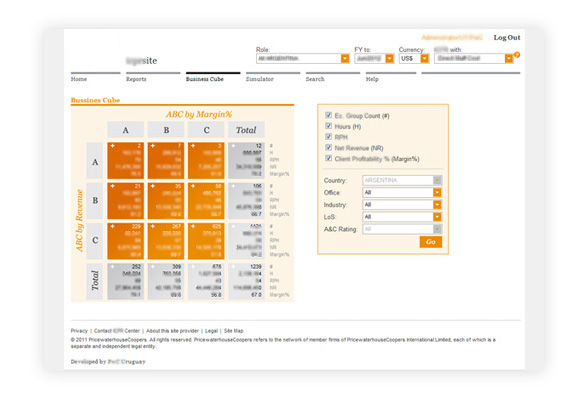
Client profitability and financial information report system
Development and maintenance of a regional business intelligence tool to support a client centric approach strategy that allows partners and managers to: i) measure client profitability within various business dimensions (LoS; Industries; Offices; individual portfolios; CRM programs; etc.) under a consistent pattern; ii) analyze clients by size and profitability; iii) access to all client's basic and contact information; and iv) project opportunities profitability
The system is based on two main modules:
- the public site, available to most partners and managers from most South American countries, allows them to analyze their business management data in a series of drill-down reports. It also provides an advanced clients/deals search engine and a proposal fees calculator. This site has a strong security schema based on roles, so the access to data is defined according to the user's role under the premise that each user must have access only to the data of his/her responsibility. Users have at least one role by default for all engagement partners and managers. Users that have more than one role are able to switch between them on the site home page. The reports are displayed for each chosen role, allowing him/her to concentrate the attention on that of his/her interest at the time.
- a back-end application which is used to normalize the data entered by the participating countries. It provides data quality management tools and access control list management, among others. The database is based on each client's project/job initially stored in their local accounting systems and then exported to a file to be synchronized with the main system (using the backend application) (ASP.NET, Oracle 10).
Client Feedback management tool
Collaboration in the development of Client Feedback, a software for managing PwC client satisfaction surveys cycle. Based on the Net Promoter Score approach, it allows mailing survey's requests to relevant PwC clients avoiding duplicate requests for each client. It also provides a simple dashboard for managers and partners to review their promoters/detractors information. Clients receive their email requests together with access information to an online form which automatically updates our internal databases. Today it is used mainly in Brazil and Argentina . (ASP.NET, Oracle 10)
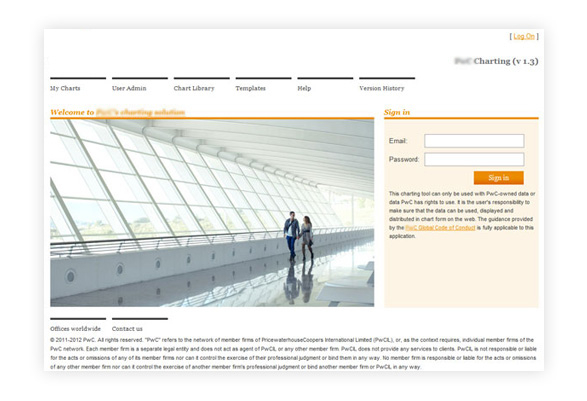
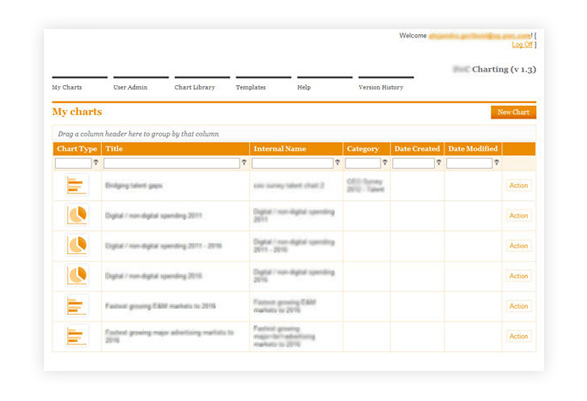
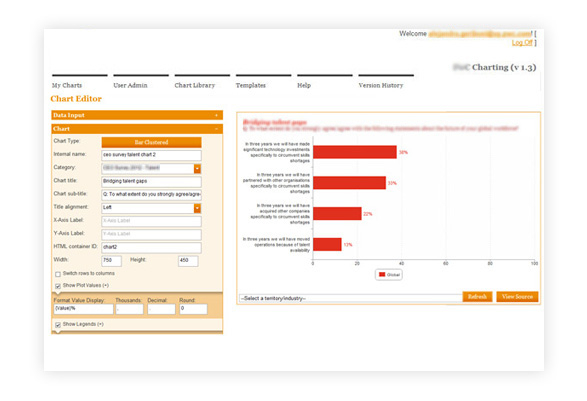
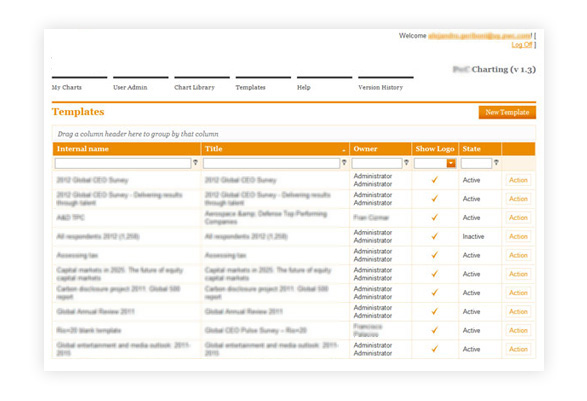
Charting Tool
Collaboration in the development of PwC Charting Tool, a web charts creation tool for webmasters. PwC Charting Tool allows webmasters to easily create web animated/interactive charts to be embedded in web pages. The user is able to copy data from an Excel spreadsheet, paste it into the tool and configure the chart in minutes. User can create charts from a list of available chart types, customize them, share and get the source code needed for the chart to work in PwC internal CMS or other similar environments. The charts are generated following PwC branding guidelines and have been developed so they display correctly on a wide variety of browsers and devices. ( ASP.NET, eXpress Persistent Objects, SQL Server, HighchartsJs, jQuery)
Twitter Cache
Requirement elicitation, design and implementation of a service that supports an internal cache for Twitter widgets on PwC sites. We created what we call a Twitter cache, using the new Twitter API (v.2) because the old Twitter API (v.1) was discontinued by Twitter after a series of previous "blackouts". They encouraged users to use their new embedded timelines, which are huge, and cannot be styled to make it comply with PwC brand guidelines.
In simple terms, our cache service runs on one of our own servers, updating from Twitter the latest tweets of our accounts. On the other side, the Twitter widget connects to that cache instead of connecting to the Twitter API, solving the API limit of requests per hour. ( ASP.NET MVC, LinkToTwitter, eXpress Persistent Object, jQuery)
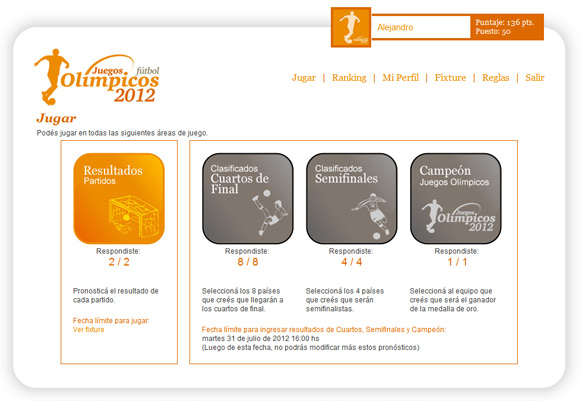
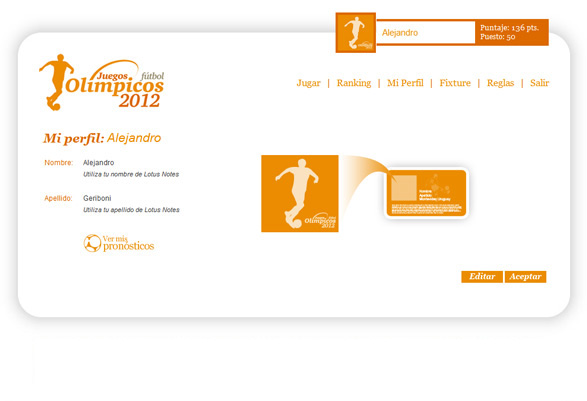
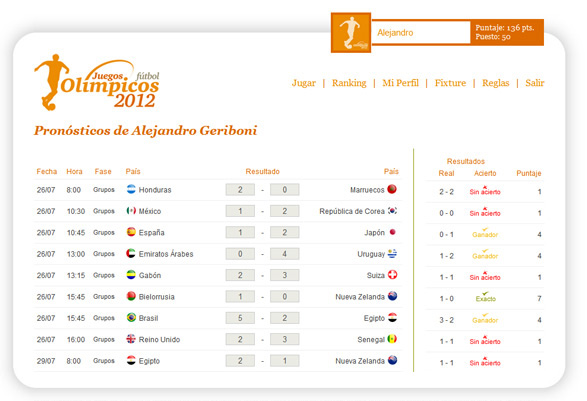
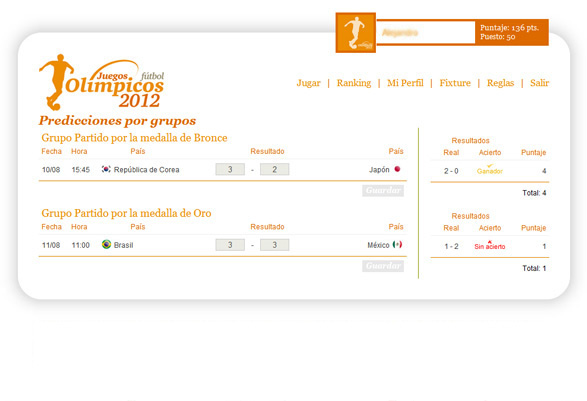
Penca
Collaboration in the development of an online football (soccer) fixture game. This game was used during the last FIFA World Cup, where PwC staff could predict matches' results. The game shows stats for each game and player, providing a global ranking. ( ASP.NET, eXpress Persistent Objects, SQL Server, jQuery)


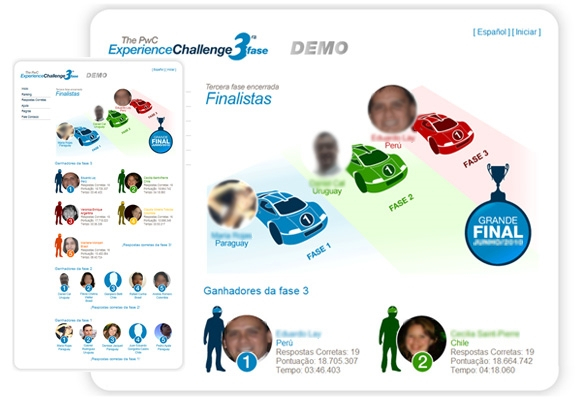
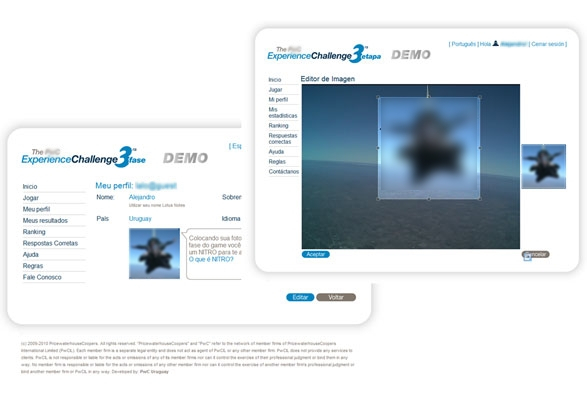
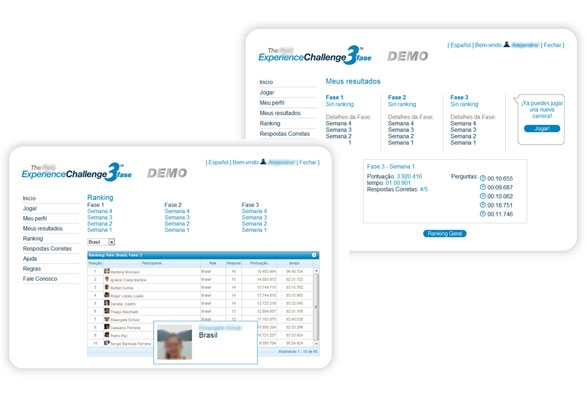
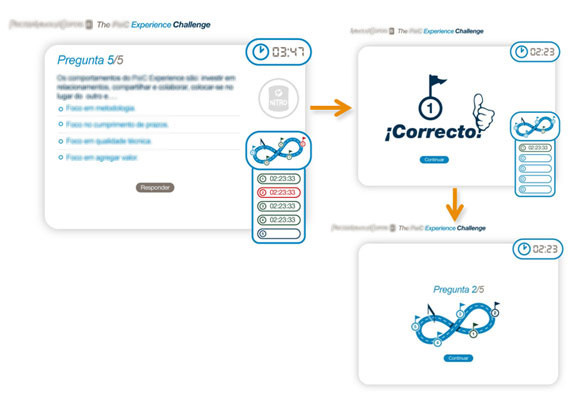
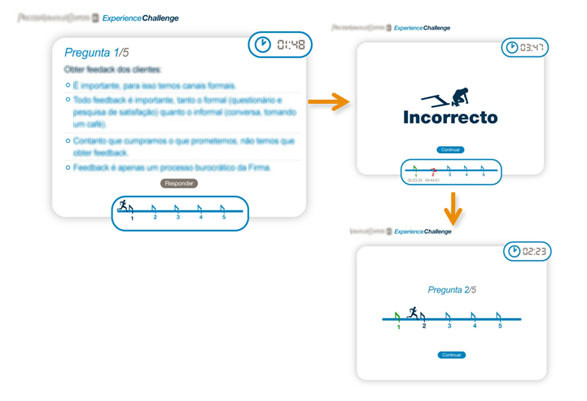
Experience Challenge
Collaboration in the development of an online quiz-like game and ranking. This game let users prove and communicate the PwC Experience precepts. The game consisted of a quiz, which calculated points for each correct answer and time between user's responses. It had several stages (races), and the winner of each stage competed for a major prize. ( ASP.NET, eXpress Persistent Objects, SQL Server, jQuery)


Online survey manager
Architecture, design and implementation of a fully configurable online survey manager with many different surveys co-existing, separate lists of users, different authentication methods and statistical information generated for the subsequent analysis of data from the survey. It was flexible and scalable enough to meet the needs of a wide range of people. Today it is used in Argentina, Perú, Chile and Uruguay. ( ASP.NET , SQLServer )
Image bank
Architecture, design and implementation of an image bank for the marketing department across Latin America. It has several forms for search, great detail in the presentation of the photographs (intensive use of AJAX), handling of different formats depending on the final use of the photos (print, PowerPoint, etc.). As an added value, the system automatically categorizes the photographs to the most precise approximation of the corporate visual identity, which allows you to find photos that match the colors used in proposals, banners, etc. (ASP.NET , Oracle 10, AJAX)
Alumni
Development and maintenance of a basic CMS with multiple users for several South American countries (Brazil, Chile, Colombia, Perú) aimed to provide content for the PwC alumni network to keep in touch with their former colleagues and friends. Also they can stay in touch with the firm through learning and networking programs, social media and newsletters. (ASP.NET, SQLServer)
BCPOrganizer
Collaboration in the development of BCPOrganizer, a tool to assist companies in the integrated management of their business continuity. It's a centralized repository that allows controlled access to contingency plans and preventive plans, while at the same time it automates most of the administration and maintenance tasks for these plans. It facilitates communication between different teams and outside entities through an automated notification system. This software was commercialized by PwC Uruguay Advisory IT area ( ASP.NET , eXpress Persistent Objects , AJAX )
RiskOrganizer
Collaboration in the development of a risk evaluation software. RiskOrganizer provides a streamlined solution to document, evaluate and report risks for any unit, project or component within an organization. Following the international COSO II standard, the system lets multiple users record objectives, risks and controls in matrices, and document action and monitoring plans based on risk exposures. Reporting functions include risk consolidation, color/heat maps and detailed risk reports, with powerful filtering and analysis tools. This software is commercialized by PwC Uruguay's Advisory IT area. ( ASP.NET, eXpress Persistent Objects, AJAX)
MetricsOrganizer
Collaboration in the development and project management of MetricsOrganizer, which allows the registration of values and the subsequent analysis of a configurable number of metrics in a controlled environment. It has a standard output of information as tables and graphics showing different indicators. (ASP.NET, eXpress Persistent Objects, AJAX)